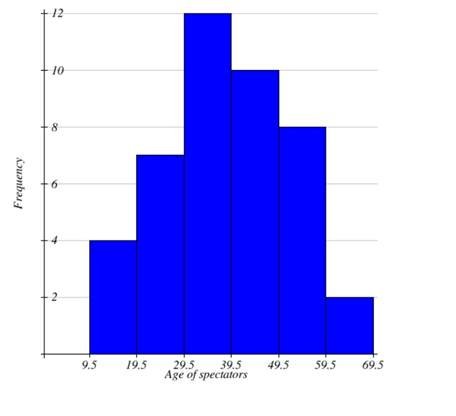
Draw a histogram to represent the following data of the spectators in a cricket match
![]()
GIVEN:
![]()
FORMULA USED: Adjustment Factor = ![]() [Lower limit –
[Lower limit –
Upper limit of preceding interval]
Adjustment Factor = ![]() [20-19]
[20-19]
= 0.5
⇒ First make the data in continuous form
IN each interval subtract 0.5 in upper limit and add 0.5 in
lower limit.
∴ the Table will be
![]()
As the data is in continuous form
⇒ Mark class interval along X axis on uniform scale
⇒ Mark frequency along Y axis on uniform scale
⇒ Construct rectangles with class intervals as base and
corresponding frequencies as height.
AI is thinking…
Couldn't generate an explanation.
Generated by AI. May contain inaccuracies — always verify with your textbook.

