Skip to content
Philoid
Browse Saved
Back to chapter
Maths
3. Data Handling
Home · Class 8 · Maths · Ref. Book · 3. Data Handling
Prev
Next
Q8 of 47 Page 70

Draw a frequency polygon for the following data without using histogram

GIVEN.


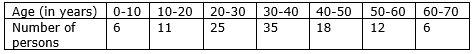
⇒ As the data is in continuous forms


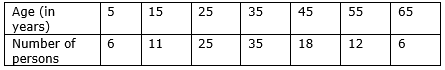
⇒ Take out Midpoints of Each class intervals


Table will be


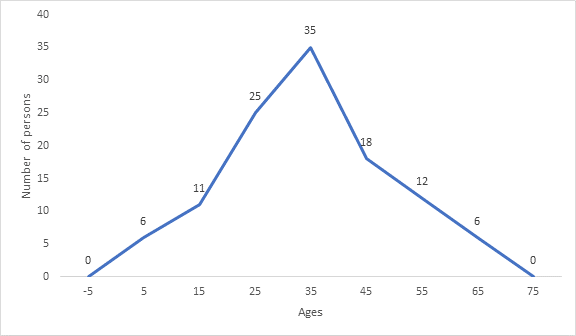
⇒ Mark class interval along X axis on uniform scale


⇒ Mark frequency along Y axis on uniform scale


Take 2 imaginary midpoints on 1st and last with 0 frequency


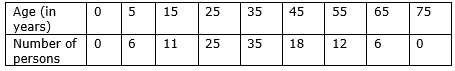
⇒ join all the midpoints to get frequency polygon


More from this chapter

All 47 →
6

The following table shows the performance of 150 candidates in an Intelligence test. Draw a histogram and frequency polygon for this distribution

7

Construct a frequency polygon from the following data using histogram.

9

Construct a frequency polygon for the following data without using histogram

10

The following are the marks obtained by 40 students in an English examination (out of 50 marks). Draw a histogram and frequency polygon for the data

29, 45, 23, 40, 31, 11, 48, 11, 30, 24, 25, 29, 25, 32, 31, 22, 19, 49, 19, 13,32, 39, 25, 43, 27, 41, 12, 13, 32, 44, 27, 43, 15, 35, 40, 23, 12, 48, 49, 18.

Questions · 47
3. Data Handling
1 2 3 4 5 6 7 8 9 10 1 2 3 4 5 6 7 8 9 10 11 12 13 14 15 1 1 1 1 1 1 1 1 1 1 2 2 2 2 2 3 3 3 3 4 4 4
Back to chapter
ADVERTISEMENT
About Contact Privacy Terms
Philoid · 2026
  • Home
  • Search
  • Browse
  • Quiz
  • Saved