What is velocity-time graph? Sate how it can be used to find:
i. acceleration of a body
ii. the displacement of a body, and
iii. the distance travelled in a given time
The Velocity – Time graph gives the change of velocity with the change in time.
Y – Axis : Velocity
X – Axis : Time
Now, slope of velocity – time graph is gives as
Slope = ![]() =
= ![]()
Since, y = v (Velocity)
And x = t (Time)
Now, there are three types of Velocity – Time graph.
a) Velocity is constant – Uniform Motion
This means that velocity remains same for all time.

b) Uniformly Accelerated Motion
This means that velocity changes at constant rate.
Slope = Constant and the graph is a straight line graph

c) Non – Uniformly Accelerated Motion
This means that velocity changes at a variable rate.
Slope = Variable and the graph is as shown below

Velocity – Time Graph can be used to find the following as:
a) Acceleration:
Slope of Velocity – Time Graph = Acceleration
Since, Slope = ![]()
So, Acceleration = ![]()
And hence, Slope = Acceleration
b) Displacement of a body:
The area under the velocity – time graph gives the displacement of the body.
Displacement = Velocity × Time
Area under the graph = Displacement of Body
For finding the area, we multiply the velocity and time.

c) Distance of a body:
Distance = Speed × Time
Now, Speed is magnitude of velocity.
Hence, as long as velocity is positive,
Area under the curve = Distance
NOTE:
If velocity is negative, then the area under the curve is negative and then the total area gives displacement. So, in that case,
Distance ![]() Displacement
Displacement
Example:
Let the velocity – time graph be as shown below:
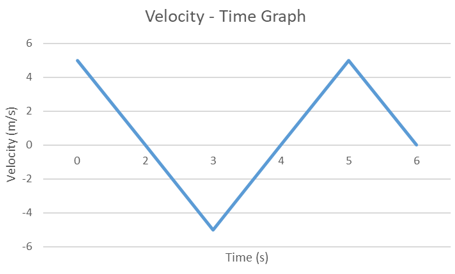
Now, Displacement = Area under the curve
= ![]()
= 5 m
Whereas, Distance = ![]()
= 15 m
For displacement we have considered the area below the time axis as negative whereas for distance, we have considered all areas as positive.
Couldn't generate an explanation.
Generated by AI. May contain inaccuracies — always verify with your textbook.