The following data is collected in a survey of some students of 10th standard from some schools. Draw the percentage bar graph of the data.

(1) First of all we prepare a table as follows:

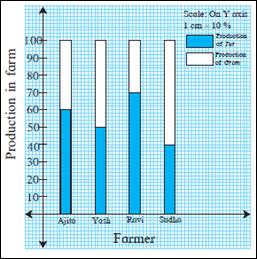
(2) In a percentage bar graph, all bars are of height 100 units.In each bar we show percentage of students inclining
towards different streams.

AI is thinking…
Couldn't generate an explanation.
Generated by AI. May contain inaccuracies — always verify with your textbook.