The runs scored by two teams A and B on the first 60 balls in a cricket match are given below:

Represent the data of both the teams on the same graph by frequency polygons.
[Hint: First make the class intervals continuous.]
To Find: Frequency polygon for the data
Given: Data of runs scored by two teams A and B on first 60 balls in a match.
Concept Used: In a frequency polygon, the number of observations is marked with a single point at the midpoint of an interval. A straight line then connects each set of points.
Explanation:
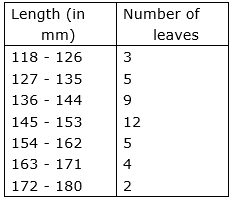
The data is represented in a discontinuous class interval. So, at first, we will make it continuous.
The difference is 1.
Hence, we subtract μ = 0.5 from the lower limit and add 0.5 to the upper limit.

Now,
We will draw frequency polygon for the given data:

Couldn't generate an explanation.
Generated by AI. May contain inaccuracies — always verify with your textbook.