Skip to content
Philoid
Browse Saved
Back to chapter
Maths
24. Data Handling-II (Graphical Representation of Data as Pie Charts
Home · Class 8 · Maths · Ref. Book · 24. Data Handling-II (Graphical Representation of Data as Pie Charts
Prev
Next
Q3 of 12 Page 25

Number of workshops organized by a school in different areas during the last five years are follows:


Years


No. of workshops


1995-1996


1996-1997


1997-1998


1998-1999


1999-2000


25


30


42


50


65


Draw a histogram representing the above data:

By drawing years on ‘x’ axis and number on workshops on ‘y’ axis .


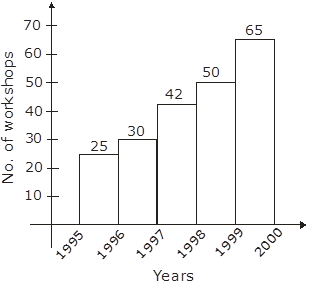
We have drowned the histogram by using the No. of workshops and years given in the question.


More from this chapter

All 12 →
1

Given below is the frequency distribution of the heights of 50 students of a class:


Class interval:


140-145


145-150


150-155


155-160


160-165


Frequency:


8


12


18


10


5


Draw a histogram representing the above data.

2

Draw a histogram of the following data:


Class interval:


10-15


15-20


20-25


25-30


30-35


35-40


Frequency:


30


98


80


58


29


50


4

In a hypothetical sample of 20 people the amounts of money with them were found to be as follows:

114, 108, 100, 98, 101, 109, 117, 119, 126, 131, 136, 143, 156, 168, 182, 195, 207, 219, 235, 118.


Draw the histogram of the frequency distribution (taking one of the class intervals as 50-100).

5

Construct a histogram for the following data:


Monthly school


Fee (in Rs)


30-60


60-90


90-120


120-150


150-180


180-210


210-240


Number of Schools :


5


12


14


18


10


9


4


Questions · 12
24. Data Handling-II (Graphical Representation of Data as Pie Charts
1 2 3 4 5 6 7 8 9 10 11 12
Back to chapter
ADVERTISEMENT
About Contact Privacy Terms
Philoid · 2026
  • Home
  • Search
  • Browse
  • Quiz
  • Saved