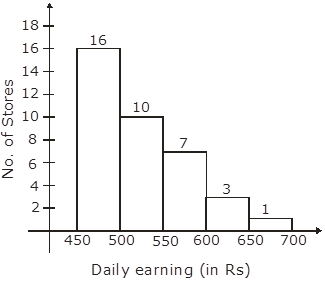
Draw a histogram for the daily earnings of 30 drug stores in the following table:
Daily earning (in Rs.) | 450-500 | 500-550 | 550-600 | 600-650 | 650-700 |
Number of Stores: | 16 | 10 | 7 | 3 | 1 |
By drawing daily earnings on ‘x’ axis and number of stores on ‘y’ axis.
AI is thinking…
Couldn't generate an explanation.
Generated by AI. May contain inaccuracies — always verify with your textbook.
