Skip to content
Philoid
Browse Saved
Back to chapter
Maths
24. Data Handling-II (Graphical Representation of Data as Pie Charts
Home · Class 8 · Maths · Ref. Book · 24. Data Handling-II (Graphical Representation of Data as Pie Charts
Prev
Next
Q7 of 12 Page 25

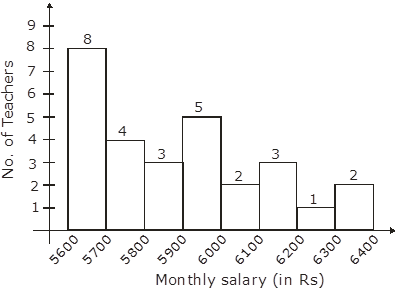
Draw a histogram to represent the following data :


Monthly salary (in Rs)


Number of teachers


5600-5700


5700-5800


5800-5900


5900-6000


6000-6100


6100-6200


6200-6300


6300-6400


8


4


3


5


2


3


1


2


By drawing monthly salary on ‘x’ axis and numbers of teacher on ‘y’ axis.


More from this chapter

All 12 →
5

Construct a histogram for the following data:


Monthly school


Fee (in Rs)


30-60


60-90


90-120


120-150


150-180


180-210


210-240


Number of Schools :


5


12


14


18


10


9


4


6

Draw a histogram for the daily earnings of 30 drug stores in the following table:


Daily earning


(in Rs.)


450-500


500-550


550-600


600-650


650-700


Number of


Stores:


16


10


7


3


1


8

The following histogram shows the number of literate females in the age group of 10 to 40 years in a town:


(i) Write the age group in which the number of literate female is the highest.


(ii) What is the class width?


(iii) What is the lowest frequency?


(iv) What are the class marks of the classes?


(v) In which age group literate females are the least?

9

The following histogram shows the monthly wages (in Rs) of workers in a factory:


(i) In which wage-group the largest numbers of worders are being kept? What is their number?


(ii) What wages are the least number of workers getting? What is the number of such workers?


(iii) What is the total number of workers?


(iv) What is the factory size?

Questions · 12
24. Data Handling-II (Graphical Representation of Data as Pie Charts
1 2 3 4 5 6 7 8 9 10 11 12
Back to chapter
ADVERTISEMENT
About Contact Privacy Terms
Philoid · 2026
  • Home
  • Search
  • Browse
  • Quiz
  • Saved