Skip to content
Philoid
Browse Saved
Back to chapter
Maths
23. Pie Charts
Home · Class 8 · Maths · Ref. Book · 23. Pie Charts
Prev
Next
Q5 of 14 Page 249

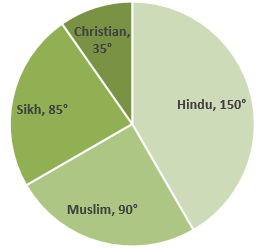
The data of religion-wise division of 1080 workers of a factory are given below:


Religion


Hindu


Muslim


Sikh


Christian


Number of workers


450


270


255


105


Represent the above data by a pie chart.

Total No. of Workers = 1080


Central Angle of Component = × 3600


Calculation of central angles


Religion


No. of Workers


Central Angle


Hindu


450


= 150o


Muslim


270


= 90o


Sikh


255


= 85o


Christian


105


= 35o


More from this chapter

All 14 →
3

Various modes of transport used by 1260 students in a given school are given below:


School


bus


Private bus


Bicycle


Rickshaw


On foot


350


245


210


175


280


Represent the above data by a pie chart.

4

The data given below shows number of hours spent by a school boy on different activities on a working day.


Activity


School


Homework


Play


Sleep


Others


Total


Numbers of hours


7


4


2


8


3


24


Represent the above data by a pie chart.

6

The marks obtained by Sudhir in an examination are given below:


Subject


English


Hindi


Mathematics


Science


Social science


Marks obtained


105


75


150


120


90


Represent the above data by a pie chart.

7

The following table gives the number of different fruits kept in a hamper.


Types of fruit


Mangoes


Apples


Oranges


Coconuts


Pomergrantes


Number


26


30


21


5


8


Represent the above data by a pie chart.

Questions · 14
23. Pie Charts
1 2 3 4 5 6 7 8 9 10 1 2 3 4
Back to chapter
ADVERTISEMENT
About Contact Privacy Terms
Philoid · 2026
  • Home
  • Search
  • Browse
  • Quiz
  • Saved