Skip to content
Philoid
Browse Saved
Back to chapter
Maths
23. Pie Charts
Home · Class 8 · Maths · Ref. Book · 23. Pie Charts
Prev
Next
Q7 of 14 Page 249

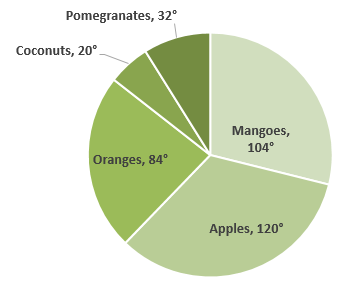
The following table gives the number of different fruits kept in a hamper.


Types of fruit


Mangoes


Apples


Oranges


Coconuts


Pomergrantes


Number


26


30


21


5


8


Represent the above data by a pie chart.

Total No. of Fruits = (26 + 30 + 21 + 5 + 8) = 90


Central Angle of Component = × 3600


Calculation of central angles


Fruit


No of Fruits


Central Angle


Mangoes


26


= 104o


Apples


30


= 120o


Oranges


21


= 84o


Coconuts


5


= 20o


Pomegranates


8


= 32o


More from this chapter

All 14 →
5

The data of religion-wise division of 1080 workers of a factory are given below:


Religion


Hindu


Muslim


Sikh


Christian


Number of workers


450


270


255


105


Represent the above data by a pie chart.

6

The marks obtained by Sudhir in an examination are given below:


Subject


English


Hindi


Mathematics


Science


Social science


Marks obtained


105


75


150


120


90


Represent the above data by a pie chart.

8

The following data shows the agricultural production in India during a certain year.


Food grain


Rice


Wheat


Coarse cereals


Pulses


Production


(in millions of tons)


57


76


38


19


Draw a pie chart to represent the above data.

9

Given below is the result of an annual examination of a class, showing the percentage of students in each category.


First division


Second division


Third division


Failed


25%


45%


20%


10%


Represent the above data by a pie chart.

Questions · 14
23. Pie Charts
1 2 3 4 5 6 7 8 9 10 1 2 3 4
Back to chapter
ADVERTISEMENT
About Contact Privacy Terms
Philoid · 2026
  • Home
  • Search
  • Browse
  • Quiz
  • Saved