Skip to content
Philoid
Browse Saved
Back to chapter
Maths
23. Pie Charts
Home · Class 8 · Maths · Ref. Book · 23. Pie Charts
Prev
Next
Q6 of 14 Page 249

The marks obtained by Sudhir in an examination are given below:


Subject


English


Hindi


Mathematics


Science


Social science


Marks obtained


105


75


150


120


90


Represent the above data by a pie chart.

Total Marks = (105 + 75 + 150 + 120 + 90) = 540


Central Angle of Component = × 3600


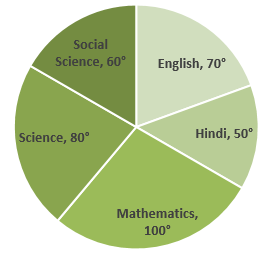
Calculation of central angles


Subject


Marks Obtained


Central Angle


English


105


= 70o


Hindi


75


= 50o


Mathematics


150


= 100o


Science


120


= 80o


Social Science


90


= 60o


More from this chapter

All 14 →
4

The data given below shows number of hours spent by a school boy on different activities on a working day.


Activity


School


Homework


Play


Sleep


Others


Total


Numbers of hours


7


4


2


8


3


24


Represent the above data by a pie chart.

5

The data of religion-wise division of 1080 workers of a factory are given below:


Religion


Hindu


Muslim


Sikh


Christian


Number of workers


450


270


255


105


Represent the above data by a pie chart.

7

The following table gives the number of different fruits kept in a hamper.


Types of fruit


Mangoes


Apples


Oranges


Coconuts


Pomergrantes


Number


26


30


21


5


8


Represent the above data by a pie chart.

8

The following data shows the agricultural production in India during a certain year.


Food grain


Rice


Wheat


Coarse cereals


Pulses


Production


(in millions of tons)


57


76


38


19


Draw a pie chart to represent the above data.

Questions · 14
23. Pie Charts
1 2 3 4 5 6 7 8 9 10 1 2 3 4
Back to chapter
ADVERTISEMENT
About Contact Privacy Terms
Philoid · 2026
  • Home
  • Search
  • Browse
  • Quiz
  • Saved