Skip to content
Philoid
Browse Saved
Back to chapter
15. Our Environment
Home · Class 10 · · Ref. Book · 15. Our Environment
Prev
Next
Q3 of 95 Page 450

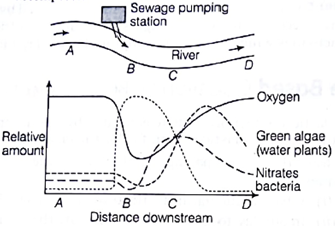
The following graph shows the concentration of oxygen in a river, measured at stations 1.5, each 100 m apart. A sewage outflow is observed just after station 1. At which stations will the concentration of organic matter be lowest?

At 1 and 5 the concentration of organic matter will be lowest because there were no decomposers. Whereas in 2,3 and 4 the decomposers were using the high amount of oxygen to decompose the organic material from sewage.

More from this chapter

All 95 →
1

The diagram shows part of a river into which sewage is being pumped. Some of the effects of adding sewage to the river are shown in the graph. At which point in the river are decomposers most active?

2

The diagram shots the flow of energy through an ecosystem.


The smallest amount of energy transferred between organisms and the largest amount of energy lost to the ecosystem is represented by which arrows?


4

Fertilizers are used on farmlands to increase the nutritive quality of soil and thus, the crop productivity. However, they greatly impact our environment in negative ways. A fertilizer Industry is planning to release nitrate free or reduced nitrate containing fertilizer to make it more environment friendly. This control of nitrate rich fertilizers is necessary because

5

The diagram shows the organisms in a habitat.


Which of the following indicates the feeding relationships of these organisms?


Questions · 95
15. Our Environment
1 2 3 4 5 6 1 2 3 4 5 6 1 2 3 4 5 6 7 1 2 3 4 5 6 1 2 3 4 5 6 7 8 9 10 11 12 13 14 15 16 17 18 19 20 21 22 23 24 25 25 26 27 28 29 30 31 32 33 34 35 36 37 38 39 39 39 40 41 42 43 44 45 46 46 47 48 49 50 51 51 51 52 52 52 52 53 53 53 1 2 3 4 5 6
Back to chapter
ADVERTISEMENT
About Contact Privacy Terms
Philoid · 2026
  • Home
  • Search
  • Browse
  • Quiz
  • Saved