In a hypothetical sample of 20 people the amounts of money with them were found to be as follows:
114, 108, 100, 98, 101, 109, 117, 119, 126, 131, 136, 143, 156, 168, 182, 195, 207, 219, 235, 118.
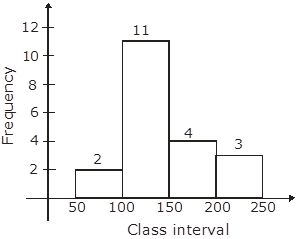
Draw the histogram of the frequency distribution (taking one of the class intervals as 50-100).

By drawing class interval on ‘x’ axis and frequency on ‘y’ axis. The height of histogram shows the frequency for particular class interval.
AI is thinking…
Couldn't generate an explanation.
Generated by AI. May contain inaccuracies — always verify with your textbook.
