Skip to content
Philoid
Browse Saved
Back to chapter
Physics
3. Rest and Motion : Kinematics
Home · Class 11 · Physics · Ref. Book · 3. Rest and Motion : Kinematics
Prev
Next
Q10 of 89 Page 51

From the velocity—time plot shown in figure (3-E5), find the distance travelled by the particle during the first 40 seconds. Also find the average velocity during this period.


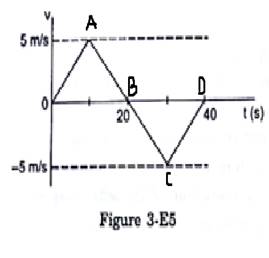
Area of the v-t graph gives distance travelled


=Area of triangle OAB+ Area of triangle BCD


Here the displacement is zero i.e. average velocity is zero


More from this chapter

All 89 →
8

Figure (3-E3) shows the graph of velocity versus time for a particle going along the X-axis. Find (a) the


acceleration, (b) the distance travelled in
0 to 10 s and (c) the displacement in O to 10 s.


9

Figure (3-E4) shows the graph of the
x-coordinate of a particle going along the X-axis as a function of time. Find (a) the average velocity during O to 10 s,
(b) instantaneous velocity at 2, 5, 8 and 12s.


11

Figure (3-E6) shows x-t graph of a particle. Find the time t such that the average velocity of the particle during the period O to t is zero.


12

A particle starts from a point A and travels along the solid curve shown in figure
(3-E7). Find approximately the position B of the particle such that the average velocity between the positions A and B has the same direction as the instantaneous velocity at B.


Questions · 89
3. Rest and Motion : Kinematics
1 2 3 4 5 6 7 8 9 10 11 12 13 14 1 2 3 4 5 6 7 8 9 10 11 12 13 1 2 3 4 5 6 7 8 9 10 1 2 3 4 5 6 7 8 9 10 11 12 13 14 15 16 17 18 19 20 21 22 23 24 25 26 27 28 29 30 31 32 33 34 35 36 37 38 39 40 41 42 43 44 45 46 47 48 49 50 51 52
Back to chapter
ADVERTISEMENT
About Contact Privacy Terms
Philoid · 2026
  • Home
  • Search
  • Browse
  • Quiz
  • Saved