Skip to content
Philoid
Browse Saved
Back to chapter
Mathematics
8. Linear Equations in Two Variables
Home · Class 9 · Mathematics · Ref. Book · 8. Linear Equations in Two Variables
Prev
Next
Q39 of 70 Page 269

Draw the graph of the equation 3x + 2y = 12. At what points does the graph cut the x-axis and the y-axis?

3x + 2y = 12


⇒ 3x + 2y = 12


⇒ 2y = 12 – 3x


When, x = 0 then,


⇒ y = 6


When, x = 4 then,


⇒ y = 0


On plotting, (0, 6) and (4, 0) we get the following graph,


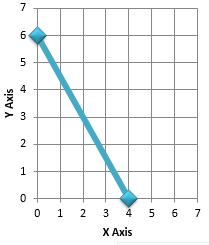
The blue line indicates the required graph of 3x + 2y = 12


It can be clearly seen from the graph, that it cuts the x axis at (4, 0) and y axis at (0, 6)


More from this chapter

All 70 →
37

Study the graph given below. Choose the equation whose graph is given:

(i) y = x (ii) y = 2x


(iii) y = 2x + 1 (iv) x + y = 0


38

Draw the graph of the equation 3x + 5y – 15 = 0 and show that x = 1, y = 2 is not a solution of the given equation.

40

Draw the graph of the equation x – 2y = 6. Verify that each of the points P(2, – 2), Q(4, – 1), and R( – 2, – 4) lies on the straight line.

41

There are two scales of measuring temperature, namely, Fahrenheit (F) and Celsius (C).

The relation between the two scales is given by


(i) Draw the graph of the given linear equation taking C along x-axis and F along y-axis.


Fill in the blanks given below:


(ii) 0°C = (…)°F (iii) 95°F = (…)°C


(iv) 0°F = (…)°C


(v) Find the temperature which is numerically the same in both (F) and (C).

Questions · 70
8. Linear Equations in Two Variables
1 2 3 4 5 6 7 1 2 3 4 5 6 7 8 9 10 11 12 13 14 15 16 17 18 19 20 21 22 23 24 25 26 27 28 29 30 31 32 33 34 35 36 37 38 39 40 41 42 43 1 2 3 4 5 6 7 8 9 10 11 12 13 14 15 16 17 18 19 20
Back to chapter
ADVERTISEMENT
About Contact Privacy Terms
Philoid · 2026
  • Home
  • Search
  • Browse
  • Quiz
  • Saved