Skip to content
Philoid
Browse Saved
Back to chapter
Maths
6. Statistics
Home · Class 10 · Maths · Ref. Book · 6. Statistics
Prev
Next
Q3 of 50 Page 157

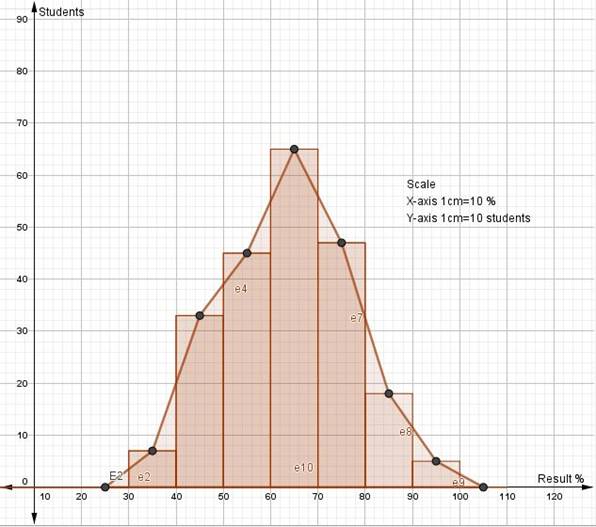
The following table shows the classification of percentages of marks of students and the number of students. Draw a frequency polygon from the table.


More from this chapter

All 50 →
1

Observe the following frequency polygon and write the answers of the questions below it.


(1) Which class has the maximum number of students?


(2) Write the classes having zero frequency.


(3) What is the class-mark of the class, having frequency of 50 students?


(4) Write the lower and upper class limits of the class whose class mark is 85.


(5) How many students are in the class 80-90?

2

Show the following data by a frequency polygon.

1

The age group and number of persons, who donated blood in a blood donation camp is given below. Draw a pie diagram from it.

2

The marks obtained by a student in different subjects are shown. Draw a pie diagram showing the information.

Questions · 50
6. Statistics
1 2 3 4 5 6 1 2 3 4 1 2 3 4 1 2 3 4 1 2 3 1 2 3 4 5 6 1 1 1 1 1 1 2 3 4 5 6 7 8 9 10 11 12 13 14 15 16 17 18
Back to chapter
ADVERTISEMENT
About Contact Privacy Terms
Philoid · 2026
  • Home
  • Search
  • Browse
  • Quiz
  • Saved