Skip to content
Philoid
Browse Saved
Back to chapter
Maths
6. Statistics
Home · Class 10 · Maths · Ref. Book · 6. Statistics
Prev
Next
Q2 of 50 Page 163

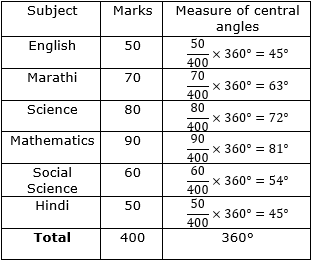
The marks obtained by a student in different subjects are shown. Draw a pie diagram showing the information.

Let us find the measures of central angles and show them in a table.

Know that,


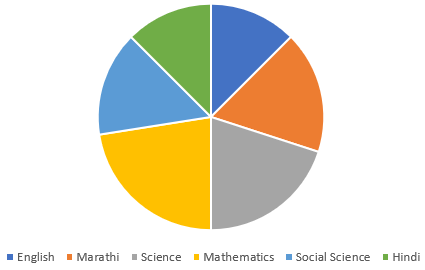
Now we shall show the table into a pie chart.


More from this chapter

All 50 →
3

The following table shows the classification of percentages of marks of students and the number of students. Draw a frequency polygon from the table.

1

The age group and number of persons, who donated blood in a blood donation camp is given below. Draw a pie diagram from it.

3

In a tree plantation programme, the number of trees planted by students of different classes is given in the following table. Draw a pie diagram showing the information.

4

The following table shows the percentages of demands for different fruits registered with a fruit vendor. Show the information by a pie diagram.

Questions · 50
6. Statistics
1 2 3 4 5 6 1 2 3 4 1 2 3 4 1 2 3 4 1 2 3 1 2 3 4 5 6 1 1 1 1 1 1 2 3 4 5 6 7 8 9 10 11 12 13 14 15 16 17 18
Back to chapter
ADVERTISEMENT
About Contact Privacy Terms
Philoid · 2026
  • Home
  • Search
  • Browse
  • Quiz
  • Saved