Skip to content
Philoid
Browse Saved
Back to chapter
Maths
6. Statistics
Home · Class 10 · Maths · Ref. Book · 6. Statistics
Prev
Next
Q12 of 50 Page 164

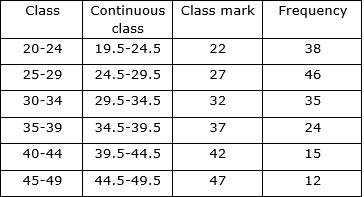
Draw a frequency polygon for the following grouped frequency distribution table.

First, draw a frequency table.


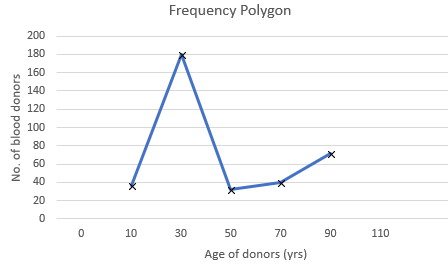
The representation into a frequency polygon will be as such.


More from this chapter

All 50 →
10

In a handloom factory different workers take different periods of time to weave a saree. The number of workers and their required periods are given below. Present the information by a frequency polygon.

11

The time required for students to do a science experiment and the number of students is shown in the following grouped frequency distribution table. Show the information by a histogram and also by a frequency polygon.

13

The following table shows the average rainfall in 150 towns. Show the information by a frequency polygon.

14

Observe the adjacent pie diagram. It shows the percentages of number of vehicles passing a signal in a town between 8 am and 10 am

(1) Find the central angle for each type of vehicle.


(2) If the number of two-wheelers is 1200, find the number of all vehicles.


Questions · 50
6. Statistics
1 2 3 4 5 6 1 2 3 4 1 2 3 4 1 2 3 4 1 2 3 1 2 3 4 5 6 1 1 1 1 1 1 2 3 4 5 6 7 8 9 10 11 12 13 14 15 16 17 18
Back to chapter
ADVERTISEMENT
About Contact Privacy Terms
Philoid · 2026
  • Home
  • Search
  • Browse
  • Quiz
  • Saved