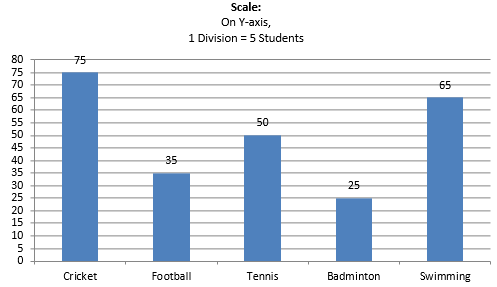
The following table shows the favorite sports of 250 students of a school. Represent the data by a bar graph.
Sports | Cricket | Football | Tennis | Badminton | Swimming |
No. of students | 75 | 35 | 50 | 25 | 65 |
AI is thinking…
Couldn't generate an explanation.
Generated by AI. May contain inaccuracies — always verify with your textbook.