Skip to content
Philoid
Browse Saved
Back to chapter
Mathematics
14. Statistic
Home · Class 9 · Mathematics · Ref. Book · 14. Statistic
Prev
Next
Q17 of 174 Page 608

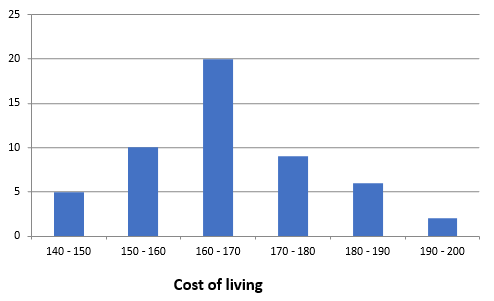
In the city, the weekly observations made on the cost of living index are given below.


Cost of living index


Number of weeks


140-160


5


150-160


10


160-170


20


170-180


9


180-190


6


190-200


2


Represent the above information in the form of a histogram.

Draw the histogram with the help of given data.


More from this chapter

All 174 →
15

The mean of six numbers is 23. If one of the numbers is excluded, the mean of the remaining numbers is 20. Find the excluded number.

16

Fill in the blanks in the following table:


Marks


Frequency


Cumulative frequency


0-5


3


3


5-10


5


.......


10-15


8


.......


15-20


4


.......


18

The mean of the marks scored by 50 students was found to be 39, Later on, it was discovered that a score was 43 was misread as 23, Find the correct mean.

19

The following table shows the weights of 12 workers in the factory.


Weight(in kg)


60


63


66


69


72


No of workers


4


3


2


2


1


Find the mean weight of the workers.

Questions · 174
14. Statistic
1 2 3 4 5 6 7 8 9 10 11 12 13 14 15 1 2 3 4 5 6 7 8 9 10 11 12 13 1 2 3 4 5 6 7 8 9 10 11 12 1 2 3 4 5 6 7 8 9 10 11 12 13 14 15 1 2 3 4 5 6 7 8 9 10 11 12 13 14 15 16 17 18 19 20 1 2 3 4 5 6 7 8 9 10 11 12 1 2 3 4 5 6 7 8 9 10 11 12 1 2 3 4 5 6 7 8 9 10 11 12 1 2 3 4 5 6 7 8 9 10 11 12 13 14 15 16 17 18 19 20 21 22 23 24 25 26 27 28 29 30 31 32 33 34 35 36 37 38 39 40 41 42 43 1 2 3 4 5 6 7 8 9 10 11 12 13 14 15 16 17 18 19 20
Back to chapter
ADVERTISEMENT
About Contact Privacy Terms
Philoid · 2026
  • Home
  • Search
  • Browse
  • Quiz
  • Saved