Skip to content
Philoid
Browse Saved
Back to chapter
Maths
7. Frequency Distribution Tables and Graphs
Home · Class 8 · Maths · Ref. Book · 7. Frequency Distribution Tables and Graphs
Prev
Next
Q2 of 33 Page 166

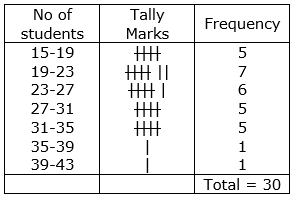
Number of students in 30 class rooms in a school are given below. Construct a frequency distribution table for the data with a exclusive class interval of 4 (students).

25 30 24 18 21 24 32 34 22 20 22


32 40 28 30 22 26 31 34 15 38 28


20 16 15 20 24 30 25 18


More from this chapter

All 33 →
20

The median of a set of 9 distinct observations is 20. If each of the largest 4 observations of the set is increased by 2, find the median of the resulting set.

1

Given below are the ages of 45 people in a colony.

33 8 7 25 31 26 5 50 25 48 56


33 28 22 15 62 59 16 14 19 24 35


26 9 12 46 15 42 63 32 5 22 11


42 23 52 48 62 10 24 43 51 37 48


36


Construct grouped frequency distribution for the given data with 6 class intervals.

3

Class intervals in a grouped frequency distribution are given as 4 – 11, 12 – 19, 20 – 27, 28 – 35, 36 – 43. Write the next two class intervals. (i) What is the length of each class interval? (ii) Write the class boundaries of all classes, (iii) What are the class marks of each class?

4

In the following grouped frequency distribution table class marks are given.


(i) Construct class intervals of the data. (Exclusive class intervals)


(ii) Construct less than cumulative frequencies and


(iii) Construct greater than cumulative frequencies.

Questions · 33
7. Frequency Distribution Tables and Graphs
1 2 3 4 5 6 7 8 9 10 11 12 13 14 15 16 17 18 19 20 1 2 3 4 5 6 7 8 1 2 3 4 5
Back to chapter
ADVERTISEMENT
About Contact Privacy Terms
Philoid · 2026
  • Home
  • Search
  • Browse
  • Quiz
  • Saved