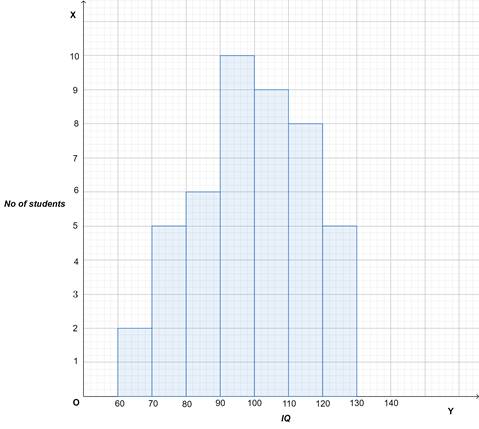
The following table gives the distribution of 45 students across the different levels of Intelligent Quotient. Draw the histogram for the data.

AI is thinking…
Couldn't generate an explanation.
Generated by AI. May contain inaccuracies — always verify with your textbook.


