Skip to content
Philoid
Browse Saved
Back to chapter
Maths
7. Frequency Distribution Tables and Graphs
Home · Class 8 · Maths · Ref. Book · 7. Frequency Distribution Tables and Graphs
Prev
Q5 of 33 Page 178

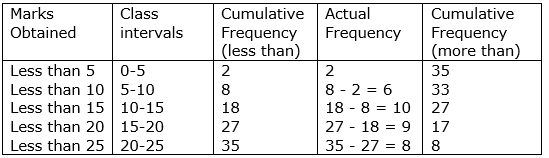
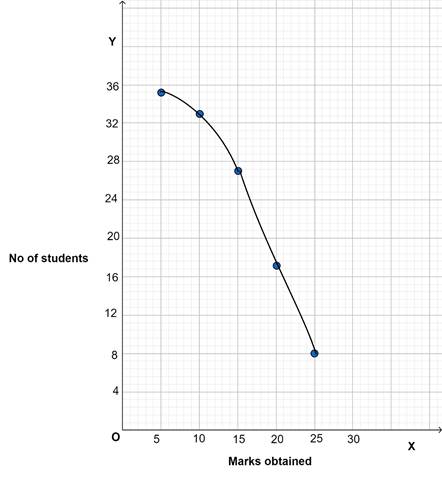
Construct class intervals and frequencies for the following distribution table. Also draw the ogive curves for the same.


Less than ogive


More than ogive


More from this chapter

All 33 →
1

The following table gives the distribution of 45 students across the different levels of Intelligent Quotient. Draw the histogram for the data.

2

Construct a histogram for the marks obtained by 600 students in the VII class annual examinations.

3

Weekly wages of 250 workers in a factory are given in the following table. Construct the histogram and frequency polygon on the same graph for the data given.

4

Ages of 60 teachers in primary schools of a Mandal are given in the following frequency distribution table. Construct the Frequency polygon and frequency curve for the data without using the histogram. (Use separate graph sheets)

Questions · 33
7. Frequency Distribution Tables and Graphs
1 2 3 4 5 6 7 8 9 10 11 12 13 14 15 16 17 18 19 20 1 2 3 4 5 6 7 8 1 2 3 4 5
Back to chapter
ADVERTISEMENT
About Contact Privacy Terms
Philoid · 2026
  • Home
  • Search
  • Browse
  • Quiz
  • Saved