Skip to content
Philoid
Browse Saved
Back to chapter
Maths
7. Frequency Distribution Tables and Graphs
Home · Class 8 · Maths · Ref. Book · 7. Frequency Distribution Tables and Graphs
Prev
Next
Q6 of 33 Page 166

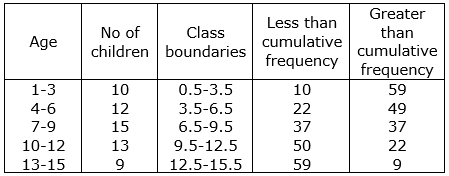
Construct the class boundaries of the following frequency distribution table. Also construct less than cumulative and greater than cumulative frequency tables.


More from this chapter

All 33 →
4

In the following grouped frequency distribution table class marks are given.


(i) Construct class intervals of the data. (Exclusive class intervals)


(ii) Construct less than cumulative frequencies and


(iii) Construct greater than cumulative frequencies.

5

The marks obtained by 35 students in a test in statistics (out of 50) are as below.

35 1 15 35 45 23 31 40 21 13 15


20 47 48 42 34 43 45 33 37 11 13


27 18 12 37 39 38 16 13 18 5 41


47 43


Construct a frequency distribution table with equal class intervals, one of them being 10-20 (20 is not included).

7

Cumulative frequency table is given below. Which type of cumulative frequency is given. Try to build the frequencies of respective class intervals.

8

Number of readers in a library are given below. Write the frequency of respective classes. Also write the less than cumulative frequency table.

Questions · 33
7. Frequency Distribution Tables and Graphs
1 2 3 4 5 6 7 8 9 10 11 12 13 14 15 16 17 18 19 20 1 2 3 4 5 6 7 8 1 2 3 4 5
Back to chapter
ADVERTISEMENT
About Contact Privacy Terms
Philoid · 2026
  • Home
  • Search
  • Browse
  • Quiz
  • Saved