Skip to content
Philoid
Browse Saved
Back to chapter
Maths
26. Statistics: Mean, Median, Ogive, Mode
Home · Class 10 · Maths · Ref. Book · 26. Statistics: Mean, Median, Ogive, Mode
Prev
Next
Q3 of 55 Page 358


Making cumulative frequency (greater than type) distribution table of given data, let us drawn Ogive on graph paper.

We have been given class intervals and frequency.

Let us create greater than type of cumulative frequency distribution table.


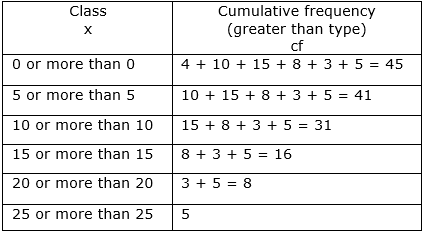
Taking Class as x-axis and cumulative frequency as y-axis.


Thus plotting the points on a graph, we get


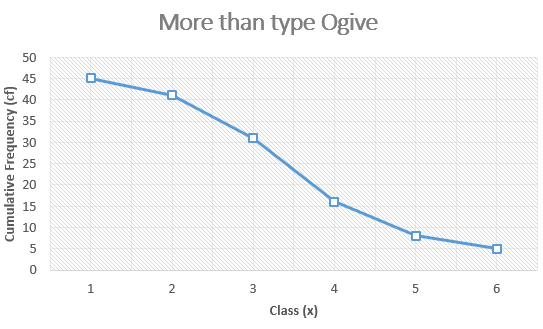
Thus, this is the more than type Ogive on graph paper.


More from this chapter

All 55 →
1

The following distribution cubic shows the daily profit (in ₹) of 100 shops of our village.


Making cumulative frequency (greater than type) distribution table of given data, let us drawn Ogive on graph paper.

2

The following data shows the weight of 35 students of class of Nivedita.


Making cumulative frequency (less than type) distribution table, let us draw Ogive on graph paper and hence let us find the median from the graph. Let us find the median by using formula and verify it.

4


Drawing less than type Ogive and greater than type Ogive of given data along same axes, on the graph paper, let us find the median from the graph.

1

Paid amounts of a day of our 16 friends for going to school and other expenditures are 15, 16, 17, 18, 17, 19, 17, 15, 15, 10, 17, 16, 15, 16, 18, 11

Let us find the mode of paid amounts of a day of our friends.

Questions · 55
26. Statistics: Mean, Median, Ogive, Mode
1 2 3 4 5 6 7 7 8 8 9 9 10 11 12 13 14 1 2 3 4 5 6 7 8 9 10 11 12 13 14 15 1 2 3 4 1 2 3 4 5 6 7 8 9 9 9 9 9 9 9 10 10 10 10
Back to chapter
ADVERTISEMENT
About Contact Privacy Terms
Philoid · 2026
  • Home
  • Search
  • Browse
  • Quiz
  • Saved