Calculate the mean, median and standard deviation of the following distribution

Given, The data is given in table/
To Find: Find the standard deviation
The formula used: SD = ![]()
Explanation:
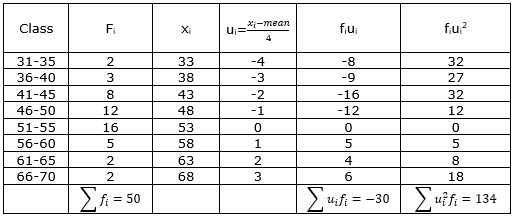
Now, N=50, ![]() ,
, ![]()
Mean ![]()
![]()
![]()

![]()
Variance = 58
Standard Deviation ![]()
SD = 7.62
Hence, The standard deviation is 7.62
AI is thinking…
Couldn't generate an explanation.
Generated by AI. May contain inaccuracies — always verify with your textbook.


