Calculate coefficient of variation from the following data :

Given, The data is given in table
To Find: Find the standard deviation of the frequency
Explanation:
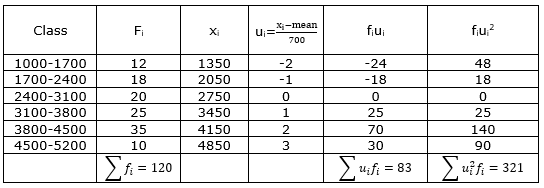
Now, N=120, ![]()
Mean ![]()
![]()
![]()


Variance = 1076332.64
Standard Deviation ![]()
SD = 1037.47
Coefficients variation =![]()
Cv=32.08
Hence, The coefficient variation is 332.08
AI is thinking…
Couldn't generate an explanation.
Generated by AI. May contain inaccuracies — always verify with your textbook.


