A 100 μF capacitor is joined to a 24 V battery through a 1.0 MΩ resistor. Plot qualitative graphs
(a) between current and time for the first 10 minutes and
(b) between charge and time for the same period.
Charging a capacitor:
A capacitor of capacitance C is being charged using a battery of emf ϵ through a resistance R . A switch S is also connected in series with the capacitor. The switch is initially open. The capacitor is uncharged at first. At t=0, the switch is closed. The current through the circuit at anytime t>0 is given by:
![]()
Where I0 is the initial current.
The charge is given by:
![]()
Note that ![]() is known as time constant.
is known as time constant.
Given,
Resistance of the resistor, ![]()
Capacitance, ![]()
Emf of the battery, ![]()
Now, time constant , ![]()
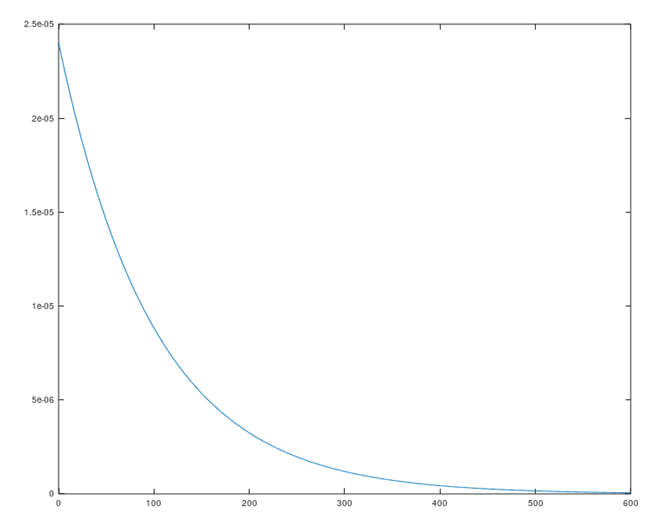
(a)
The current is given by:
![]()
At t =0, we have y-intercept I0.
Now,
![]()
![]()
![]()
Hence, we need to plot
![]()
At t = 10min = 600s,
![]()
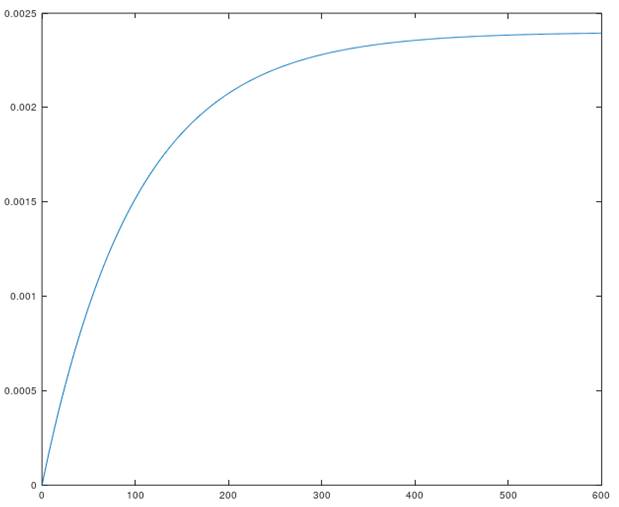
(b)
Now,
![]()
Note that the current is in Ampere and time in seconds. The graph will represent exponential decay.
We need to plot
![]()
Note that t is in seconds and Q in coulombs.
At t = 10 min = 600s,
![]()
The charge will keep on increasing and will almost touch the asymptope at Q = 0.0024C.
Couldn't generate an explanation.
Generated by AI. May contain inaccuracies — always verify with your textbook.