Q14 of 52 Page 23

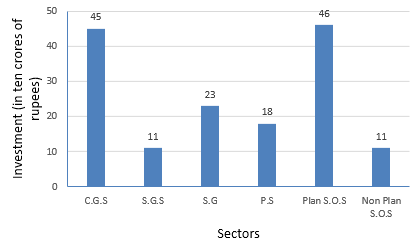
The investment (in ten crores of rupees) of Life Insurance Corporation of India in different sectors are given below:


Sectors


Investment


(in ten crores of rupees)


Central Govt. Securities


State Govt. Securities


Securities guaranteed by the Govt.


Private sectors


Socially oriented sectors (plan)


Socially oriented sectors (Non plan)


45


11


23


18


46


11


Represent the above data with the help of a bar graph.


More from this chapter

All 52 →
12

The following data gives the demand estimates of the Government of India, Department of Electronics for the personnel in the computer sector during the Eighth Plan period (1990-95):


Qualifications


MCA


(Master in Computer


Application)


DCA


(Diploma in computer application


DCE


(Diploma in Computer Engineering


CL


(Certificate Level Course)


ST


(Short term Course)


Personnel


Required


40600


181600


18600


670600


1802900


Represent the data with the help of a bar graph. Indicate with the help of the bar graph the course where estimated requirement is least.

13

The income and expenditure for 5 years of a family is given in the following data:


Years


1995-96


1996-97


1997-98


1998-99


1999-2000


Income (Rs. in thousands


100


140


150


170


210


Expenditure (Rs. in


Thousands)


80


130


145


160


190


Represent the above data by a bar graph.

15

The following data gives the value (in crores of rupees) of the Indian export of cotton textiles for different years:


Years


1982


1983-84


1984-85


1985-86


1986-87


Value of Exports of Cotton Textiles (in crore of rupees)


300


325


475


450


550


Represent the above data with the help of a bar graph. Indicate with the help of a bar graph the year in which the rate of increase in exports is maximum over the preceding year.

16

The following table gives the quantity of goods (in crore tonnes).


Year


1950-51


1960-61


1965-66


1970-71


1980-81


1982-83


Quantity of goods


(in crore tonnes).


9


16


20


20


22


26


Represent this information with the help of a bar graph.


Explain through the bar graph if the quantity of goods carried by the Indian Railway in 1965-66 is more than double the quantity of goods carried in the year 1950-51.