Skip to content
Philoid
Browse Saved
Back to chapter
Mathematics
23. Graphical Representation of Statistical Data
Home · Class 9 · Mathematics · Ref. Book · 23. Graphical Representation of Statistical Data
Prev
Next
Q18 of 52 Page 23

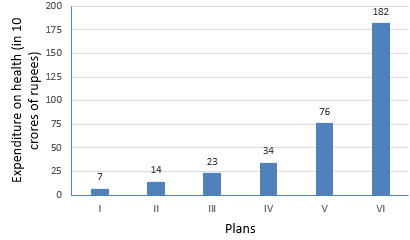
The expenditure (in 10 crores of rupees) on health by the Government of India during the various five year plans is shown below:


Plans :


I


II


III


IV


V


VI


Expenditure On health


(in 10 crores of rupees)


7


14


23


34


76


182


Construct a bar graph to represent the above data.


More from this chapter

All 52 →
16

The following table gives the quantity of goods (in crore tonnes).


Year


1950-51


1960-61


1965-66


1970-71


1980-81


1982-83


Quantity of goods


(in crore tonnes).


9


16


20


20


22


26


Represent this information with the help of a bar graph.


Explain through the bar graph if the quantity of goods carried by the Indian Railway in 1965-66 is more than double the quantity of goods carried in the year 1950-51.

17

The production of oil (in lakh tonnes) in some of the refineries in India during 1982 was given below:


Refinery


Barauni


Koyali


Mathura


Mumbai


Florida


production of oil (in lakh tonnes)


30


70


40


45


25


Construct a bar graph to represent the above data so that the bars are drawn horizontally.

1

Construct a histogram for the following data:


Monthly school


Fee (in Rs.)


30-60


60-90


90-120


120-150


150-180


180-210


210-240


No. of schools


5


12


14


18


10


9


4


2

The distribution of heights (in cm) of 96 children is given below. Construct a histogram and a frequency polygon on the same axes.


Height (in cm)


124 to 128


128 to 132


132 to 136


136 to 140


140 to 144


144 to 148


148 to 152


152 to 156


156 to 160


160 to 164


No. Of


children


5


8


17


24


16


12


6


4


3


1


Questions · 52
23. Graphical Representation of Statistical Data
1 2 3 4 5 6 7 8 9 10 11 12 13 14 15 16 17 18 1 2 3 4 5 6 7 8 9 10 11 12 13 14 15 16 17 18 1 2 3 4 5 6 7 8 1 2 3 4 5 6 7 8
Back to chapter
ADVERTISEMENT
About Contact Privacy Terms
Philoid · 2026
  • Home
  • Search
  • Browse
  • Quiz
  • Saved