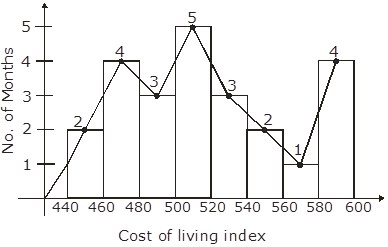
Draw, in the same diagram, a histogram and a frequency polygon to represent the following data which shows the monthly cost of living index of a city in a period of 2 years:
Cost of living index | 440-460 | 460-480 | 489-500 | 500-520 | 520-540 | 540-560 | 560-580 | 580-600 |
No. of months: | 2 | 4 | 3 | 5 | 3 | 2 | 1 | 4 |
AI is thinking…
Couldn't generate an explanation.
Generated by AI. May contain inaccuracies — always verify with your textbook.