Skip to content
Philoid
Browse Saved
Back to chapter
Mathematics
23. Graphical Representation of Statistical Data
Home · Class 9 · Mathematics · Ref. Book · 23. Graphical Representation of Statistical Data
Prev
Next
Q5 of 52 Page 23

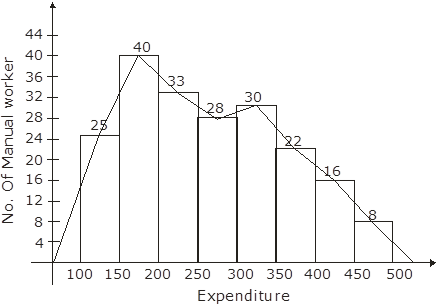
The following is the distribution of total household expenditure (in Rs.) of manual worker in a city:


Expenditure (in Rs.)


100-150


150-200


200-250


250-300


300-350


350-400


400-450


450-500


No. of manual worker


25


40


33


28


30


22


16


8


Draw a histogram and a frequency polygon representing the above data.


More from this chapter

All 52 →
3

The time taken, in seconds, to solve a problem by each of 25 pupiles is as follows:

16, 20, 26, 27, 28, 30, 33, 37, 38, 40, 42, 43, 46, 46, 46, 48, 49, 50, 53, 58, 59, 60, 64, 52, 20


(a) Construct a frequency distribution for these data, using a class interval of 10 seconds.


(b) Draw a histogram to represent the frequency distribution.

4

Draw, in the same diagram, a histogram and a frequency polygon to represent the following data which shows the monthly cost of living index of a city in a period of 2 years:


Cost of living index


440-460


460-480


489-500


500-520


520-540


540-560


560-580


580-600


No. of months:


2


4


3


5


3


2


1


4


6

The following table gives the distribution of IQ’s (intelligence quotients) of 60 pupils of class V in a school.


IQ’s


125.5


To


132.5


118.5


To


125.5


111.5


To


118.5


104.5


To


111.5


97.5


To


104.5


90.5


To


97.5


83.5


To


90.5


76.5


To 83.5


69.5


To 76.5


62.5


To


69.5


No. of pupils


1


3


4


6


10


12


15


5


3


1


Draw a frequency polygon for the above data.

7

Draw a histogram for the daily earnings of 30 drug stores in the following table:


Daily earnings (in Rs.)


450-500


500-550


550-600


600-650


650-700


Number of stores:


16


10


7


3


1


Questions · 52
23. Graphical Representation of Statistical Data
1 2 3 4 5 6 7 8 9 10 11 12 13 14 15 16 17 18 1 2 3 4 5 6 7 8 9 10 11 12 13 14 15 16 17 18 1 2 3 4 5 6 7 8 1 2 3 4 5 6 7 8
Back to chapter
ADVERTISEMENT
About Contact Privacy Terms
Philoid · 2026
  • Home
  • Search
  • Browse
  • Quiz
  • Saved