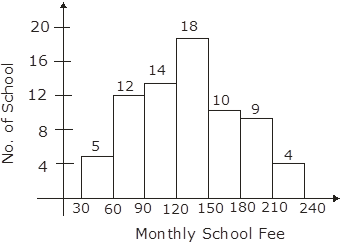
Construct a histogram for the following data:
Monthly school Fee (in Rs.) | 30-60 | 60-90 | 90-120 | 120-150 | 150-180 | 180-210 | 210-240 |
No. of schools | 5 | 12 | 14 | 18 | 10 | 9 | 4 |
AI is thinking…
Couldn't generate an explanation.
Generated by AI. May contain inaccuracies — always verify with your textbook.