Maria has written the ages of 300 patients of a hospital in the table given below:
I construct a more than type cumulative frequency distribution table for the above data.

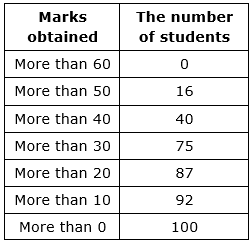
This type of frequency distribution table is calculated on the basis of total number of data in or above the range. In this question in the range more than 10 years we have to conclude the patients also who has age more than 10 years like the patient whose age is 20,35,50,65,70 etc. Hence Frequency for More than 10 years will be sum of all the patient(data) including that and its above ranges i.e
80 + 40 + 50 + 70 + 40 + 20 = 300.
More than type cumulative distribution frequency table

Couldn't generate an explanation.
Generated by AI. May contain inaccuracies — always verify with your textbook.