Skip to content
Philoid
Browse Saved
Back to chapter
Mathematics
11. Statistics
Home · Class 9 · Mathematics · Ref. Book · 11. Statistics
Prev
Next
Q7 of 35 Page 209

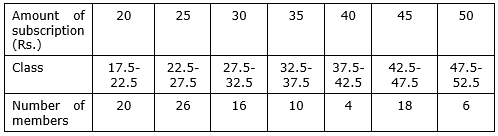
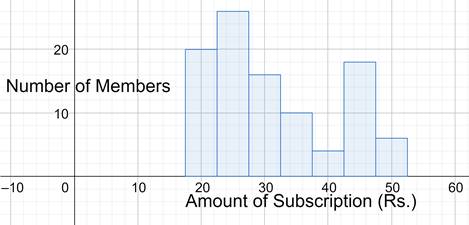
By drawing histogram, I draw the frequency polygon of the frequency distribution table given below:

The data is not related to class and the difference of two consecutive values is 5.

∴ To obtain class lengths, I shall take the mid points of the class-interval.


17.5-22.5, 22.5-27.5, 27.5-32.5, 32.5-37.5, 37.5-42.5, 42.5-47.5, 47.5-52.5, for wages 20,25,30,35,40,45,50 respectively.


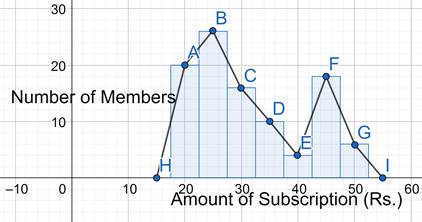
By joining the middle values of classes, we get the frequency polygon


More from this chapter

All 35 →
5

I construct the frequency polygon for the following marks obtained by 75 leamers of Pritha’s school.


In the graph paper, taking suitable measures along horizontal and vertical lines, the points (20, 0), (30, 12), (40, 18), (50, 21), (60, 15), (70, 6), (80, 3) and (90, 0) are plotted on the graph paper and then I draw the frequency polygon by adding them.

6

I draw the frequency polygon for the following frequency distribution table.

8

I draw the histogram for the following frequency distribution table.


Hints: At first, by exclusive class method the statistical data will be constructed as frequency distribution table with class-boundaries given below:


9

I have written the ages of 32 teachers of Primary School in the village Virsingha in a table given below:


I represent the above given data graphically by histogram and frequency polygon.

Questions · 35
11. Statistics
1 2 3 4 5 6 7 8 8 8 8 8 9 9 9 9 9 1 2 3 4 5 6 7 8 9 10 11 12 13 14 14 14 14 14
Back to chapter
ADVERTISEMENT
About Contact Privacy Terms
Philoid · 2026
  • Home
  • Search
  • Browse
  • Quiz
  • Saved