Skip to content
Philoid
Browse Saved
Back to chapter
Mathematics
11. Statistics
Home · Class 9 · Mathematics · Ref. Book · 11. Statistics
Prev
Next
Q6 of 35 Page 195

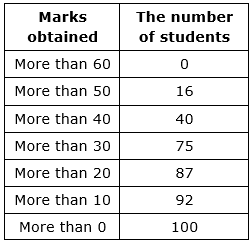
Let us observe the following cumulative frequency distribution table and construct a frequency distribution table:

lower class boundary = lower limit - 0.5

Upper class boundary = upper limit + 0.5


Mid value of class


class - size = upper class boundary – lower class boundary


Frequency density = class frequency of that class/class size


The class - limit in this table is exclusive type


More from this chapter

All 35 →
4

Mitali and Mohidul wrote below the amount of money of electricity bills for this month of the 45 houses of their village.

116, 127, 100, 82, 80, 101, 91, 65, 95, 89, 75, 92, 129, 78, 87, 101, 65, 52, 59, 65, 95, 108, 115, 121, 128, 63, 76, 130, 116, 108, 118, 61, 129, 127, 91, 130, 125, 101, 116, 105, 92, 75, 98, 65, 100.


I construct a frequency distribution table for the above data.

5

Maria has written the ages of 300 patients of a hospital in the table given below:

I construct a more than type cumulative frequency distribution table for the above data.


7

Let us observe the following cumulative frequency distribution table and construct the frequency distribution table:

8

Which one of the following is a graphical (pictorial) representation of a statistical data?

Questions · 35
11. Statistics
1 2 3 4 5 6 7 8 8 8 8 8 9 9 9 9 9 1 2 3 4 5 6 7 8 9 10 11 12 13 14 14 14 14 14
Back to chapter
ADVERTISEMENT
About Contact Privacy Terms
Philoid · 2026
  • Home
  • Search
  • Browse
  • Quiz
  • Saved