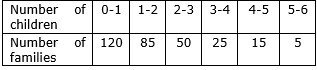
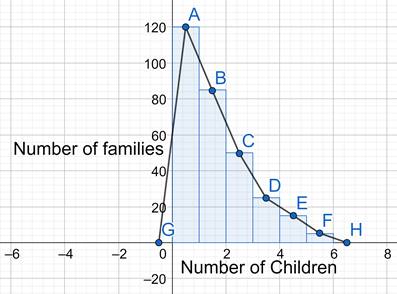
I draw the histogram for the following frequency distribution table.

Hints: At first, by exclusive class method the statistical data will be constructed as frequency distribution table with class-boundaries given below:

We will make the histogram with the data with class boundaries
AI is thinking…
Couldn't generate an explanation.
Generated by AI. May contain inaccuracies — always verify with your textbook.


