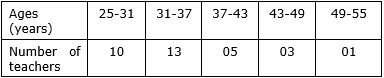
I have written the ages of 32 teachers of Primary School in the village Virsingha in a table given below:

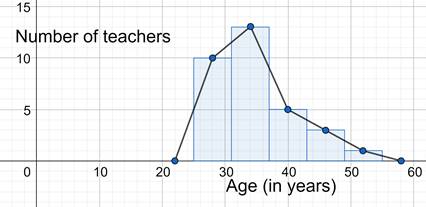
I represent the above given data graphically by histogram and frequency polygon.
By using the data
We make a histogram and then by joining middle values of classes we get the frequency polygon.
AI is thinking…
Couldn't generate an explanation.
Generated by AI. May contain inaccuracies — always verify with your textbook.


