The graphs of y – p(x) are given in the figures below, where p(x) is a polynomial. Find the number of zeros in each case.
(i)  (ii)
(ii) 
(iii)  (iv)
(iv) 
(v)  (vi)
(vi)
(i) Here, the graph of y = p(x) intersects the x – axis at two points. So, the number of zeroes is 2.
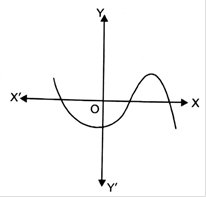
(ii) Here, the graph of y = p(x) intersects the x – axis at three points. So, the number of zeroes is 3.
(iii) Here, the graph of y = p(x) intersects the x – axis at one point only. So, the number of zeroes is 1.
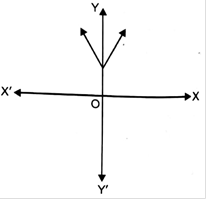
(iv) Here, the graph of y = p(x) intersects the x – axis at exactly one point. So, the number of zeroes is 1.
(v) Here, the graph of y = p(x) intersects the x – axis at two points. So, the number of zeroes is 2.
(vi) Here, the graph of y = p(x) intersects the x – axis at exactly one point. So, the number of zeroes is 1.
Couldn't generate an explanation.
Generated by AI. May contain inaccuracies — always verify with your textbook.
 (ii)
(ii) 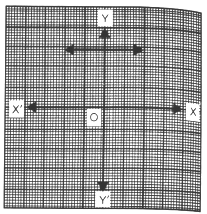
 (iv)
(iv) 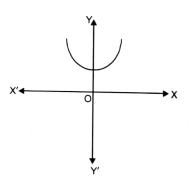


 (ii)
(ii) 
 (iv)
(iv) 
 (vi)
(vi) 