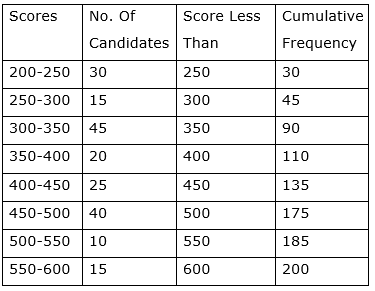
The table given below shows the frequency distribution of the scores obtained by 200 candidates in a BCA entrance examination:

Draw cumulative frequency curve using 'less than series'.

AI is thinking…
Couldn't generate an explanation.
Generated by AI. May contain inaccuracies — always verify with your textbook.

